
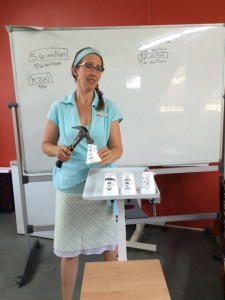
Michelle Waldron updating the staff on HIV, by using polystyrene cups to represent the different vulnerability groups.
A couple of weeks ago during our staff meeting we looked at HIV-related statistics and what these numbers actually mean to us in our daily ministry at SOH.
We used styrofoam cups to represent vulnerable age groups/population groups, and their vulnerability was shown by smashing the cups with a hammer.
Big picture stats:
• 37 million people living in the world with HIV.
• 24 million of them in Sub-Saharan Africa.
• 5.6 million of them in South Africa.
• 3.3 million of them in KZN.
But what does that mean to us here at SOH. How does that 3.3 million translate into our daily work?
We were inspired that no matter what our ministry was, sewing, teaching, aerobics, farming, etc, that vulnerable people are in our contact daily and we have been challenged to look for more opportunities to minister to those we come in contact with.
High Risk Groups:
High risk groups are “… specific groups that have HIV prevalence above the national
average (12.2%) which are classified as key populations with higher risk of HIV exposure.
These groups require targeted interventions. This survey identified these groups as:
1. Black African females aged 20–34 years (HIV prevalence of 31.6%),
2. People co-habiting (30.9%),
3. Black African males aged 25–49 years (25.7%),
4. Disabled persons * 15 years and older (16.7%),
5. High-risk alcohol drinkers ** 15 years and older (14.3%), and
6. Recreational drug users (12.7%).
Children in KZN (KwaZulu Natal):
1. 1 out of 4 children are orphaned.
2. 1 out of 4 children live with both parents.
3. Children who have lost both parents are 7 times as likely to become HIV+ than non-
orphans.
4. 64.5% children live in households that per capita earn less than R765 per month. (1 in
3 children in KZN live in poverty.)
Women:
1. KZN is the highest with 37 out of 100 pregnant women who test HIV+.
2. 1 in 4 women in antenatal survey are younger than 19.
3. 1 out of every 4 new infections occurs in young females aged 15-24.
References
1 Social profile of vulnerable groups 2002–2012. Report No. 03-19-00 (2002–2012). 2013. © Statistics South Africa. To download click here.
2 Shisana, O, Rehle, T, Simbayi LC, Zuma, K, Jooste, S, Zungu N, Labadarios, D, Onoya, D et al. (2014) South African National HIV
Prevalence, Incidence and Behaviour Survey, 2012. Cape Town, HSRC Press.
To download click here.
3 The 2012 National Antenatal Sentinel HIV and Herpes Simplex type-2 prevalence Survey, South Africa, National Department of Health.